When Influenza surfaced in the spring of 1918, it was fresh on the heels of a respiratory disease epidemic lasted from 1915 until 1917. Was the outbreak in 1918 caused by the same agent? Would this disease ease off in another year or two as before? There was no understanding of virus or zoonosis. In fact, it was not until 1995 that the 1918 virus was properly identified from influenza archived material. It was then we learned that the 1918 pandemic had its origin in both human and swine virus H1N1, a novel virus.
In this post we look at two key “take-aways” from 1918: virus reproduction and immunity.
Reproduction = R
In epidemiology of disease spread there is an important number expressed by the math term of “R naught” or Ro. This R number is an important measure of the rate at which the virus will reproduce by infecting another person. An R of 1 means every person carrying the virus can infect 1 other person, if the R is above 1 the growth of infection follows an exponential path.
 In 1918 pandemic the R number is estimated as 1.4-2.8, meaning that every person who had the virus infected more than 1 other person on average. The pattern of the 1918 flu began in spring, ebbed in the summer, and returned in the fall with a dramatic spike in cases and deaths. It finally faded away in the spring of 1919 with 50 million people having died from the disease.
Today, we know the source of our pandemic is also a virus, SARS CoV-2 also known as COVID 19. The science has moved at warped speed in the past six months as we continue to learn how it is affecting the human body, if there are treatments that may improve outcomes and if there will be a vaccine to prevent its spread.
The R number for COVID 19 was originally estimated at 2.2-2.7 but these numbers are changing as the data continues to grow. In an article from Emerging Infectious Diseases, an early release by the CDC, the estimate based on data from China had an R of 5.7, making this a rapidly transmitting virus when there are no boundaries on social behavior.
There is a helpful map that shows the R number by state, called the COVID exit strategy. It is a resource used by the White House and states to understand lifting restrictions in a reasonable way that will minimize transmission.
In 1918 they had no understanding of the disease cause and limited treatments. Supportive care was it. Today we have many more resources and the knowledge base continues to grow. We do not, however have proven treatments nor immunity.
Will we see a similar pattern to 1918 with a dramatic increase in the fall and yet a third wave in the spring of next year?
Immunity

The 20th century brought an amazing amount of scientific discovery to health. Forty percent of children with Diphtheria died in a desperate struggle to breath before the vaccine appeared in the 1920s. In 1925 children in Alaska were saved by a dog sled team carrying the vaccine from Anchorage to Nome. In 1953 the Salk vaccine removed the scourge of polio that sent thousands of children to the iron lung to prevent their death. This history is a reminder that science will bring forward new treatments and vaccines.
Unfortunately, with regards to COVID 19 we are like the people of 1918 because:
- there is no natural immunity to the virus
- there is no vaccine
- there is only a limited way to control the spread of the disease
These three factors mean all of us are vulnerable to infection. In the case of COVID 19 the world is engaged in the dramatic and frightening scenario of a respiratory virus that…unlike SARS 1 in 2003…can spread when someone has no symptoms.
Tools: Public Health and Us
 Compared to other countries the US has been slow to move on testing and we’ve very limited infrastructure for contact tracing. These two basic tools of public health, test and contact tracing, allow more free movement of people who are not carrying the virus. People who test positive isolate. When these three tools are used effectively lockdown methods are limited based on the R number of infections. Without this the virus is free to spread unless lockdown is used for longer time.
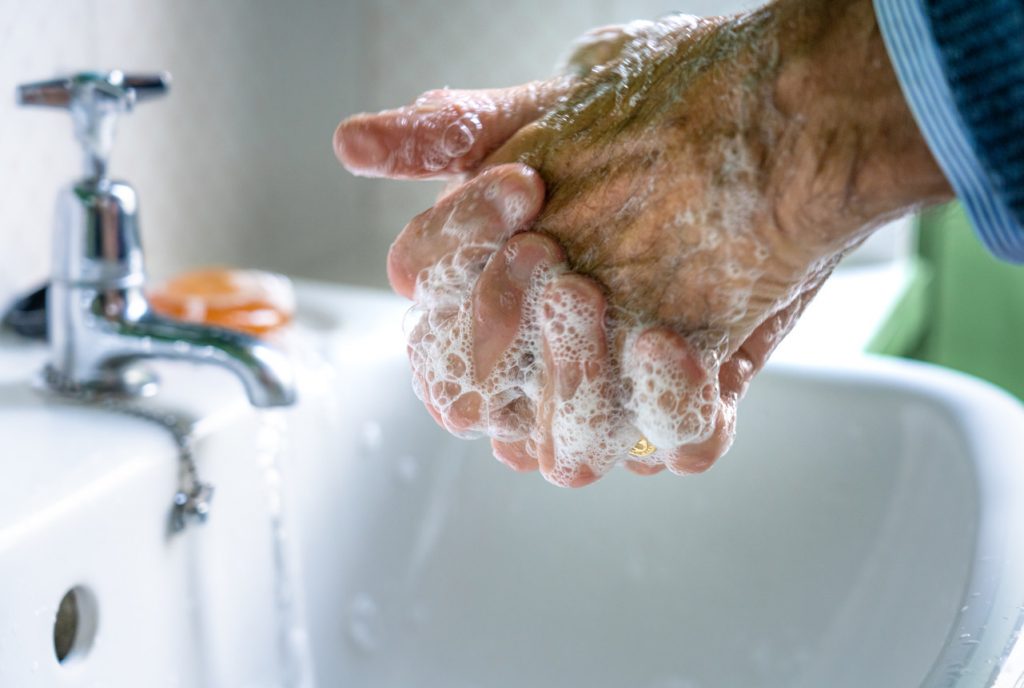
Our best defense today is to continue to monitor our behaviors with social distance, good hand washing, and self-care in diet, exercise and sleep. All of these actions support our innate immune system. Summer may provide some relief from disease transmission, but it is not a certainty.
Refer to the exit strategy map to understand the R for your state and to your state health department website for updates. Keep in mind that crowds are great breeding grounds for this aggressive virus and use the links on our Resource page for evidence-based updates on the virus. If you need a refresher on the R, use the link on our homepage and the graphics will reinforce the exponential growth rate that the R number reflects.

Leave a Reply